Gjør som tusenvis av andre bokelskere
Abonner på vårt nyhetsbrev og få rabatter og inspirasjon til din neste leseopplevelse.
Ved å abonnere godtar du vår personvernerklæring.Du kan når som helst melde deg av våre nyhetsbrev.
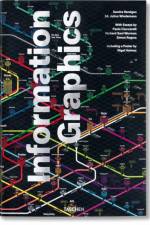
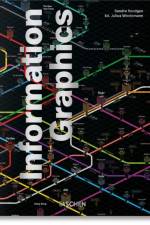
Graphs, maps, stats, and diagrams: this XL collection of infographics explores the development of visual communication in the big data age. More than 400 exemplary graphics-ranging from journalism to art, government to education-are accompanied by essays tracing the evolving art form that is pictorial explanation. Complete with fact sheets...
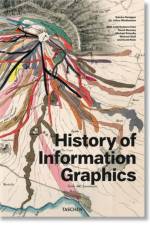
From cosmic charts and da Vinci's Vitruvian Man to the New York subway map: trace the history of visual data from the Middle Ages to the digital era in this XL compendium. Featuring some 400 infographic milestones across technology, cartography, zoology, and more, this is an unprecedented reference work for designers, history buffs, and anyone...
Abonner på vårt nyhetsbrev og få rabatter og inspirasjon til din neste leseopplevelse.
Ved å abonnere godtar du vår personvernerklæring.